How-To: Monitor Usage
This guide shows how to read the Summary card on the Models page. For the period you choose, it shows how long each model's worker ran and how many queries ran on that model, so you can see whether the runtime is being used.
Before you start
For each model, the Summary shows worker hours and the queries that ran on it, for the period you pick.
The Summary shows the last day, month or year. The page refreshes it every minute.
A worker keeps running, and using time, when nobody is querying. Many hours and few queries means it was up longer than it was needed.
Read the summary
- Console
- Python SDK
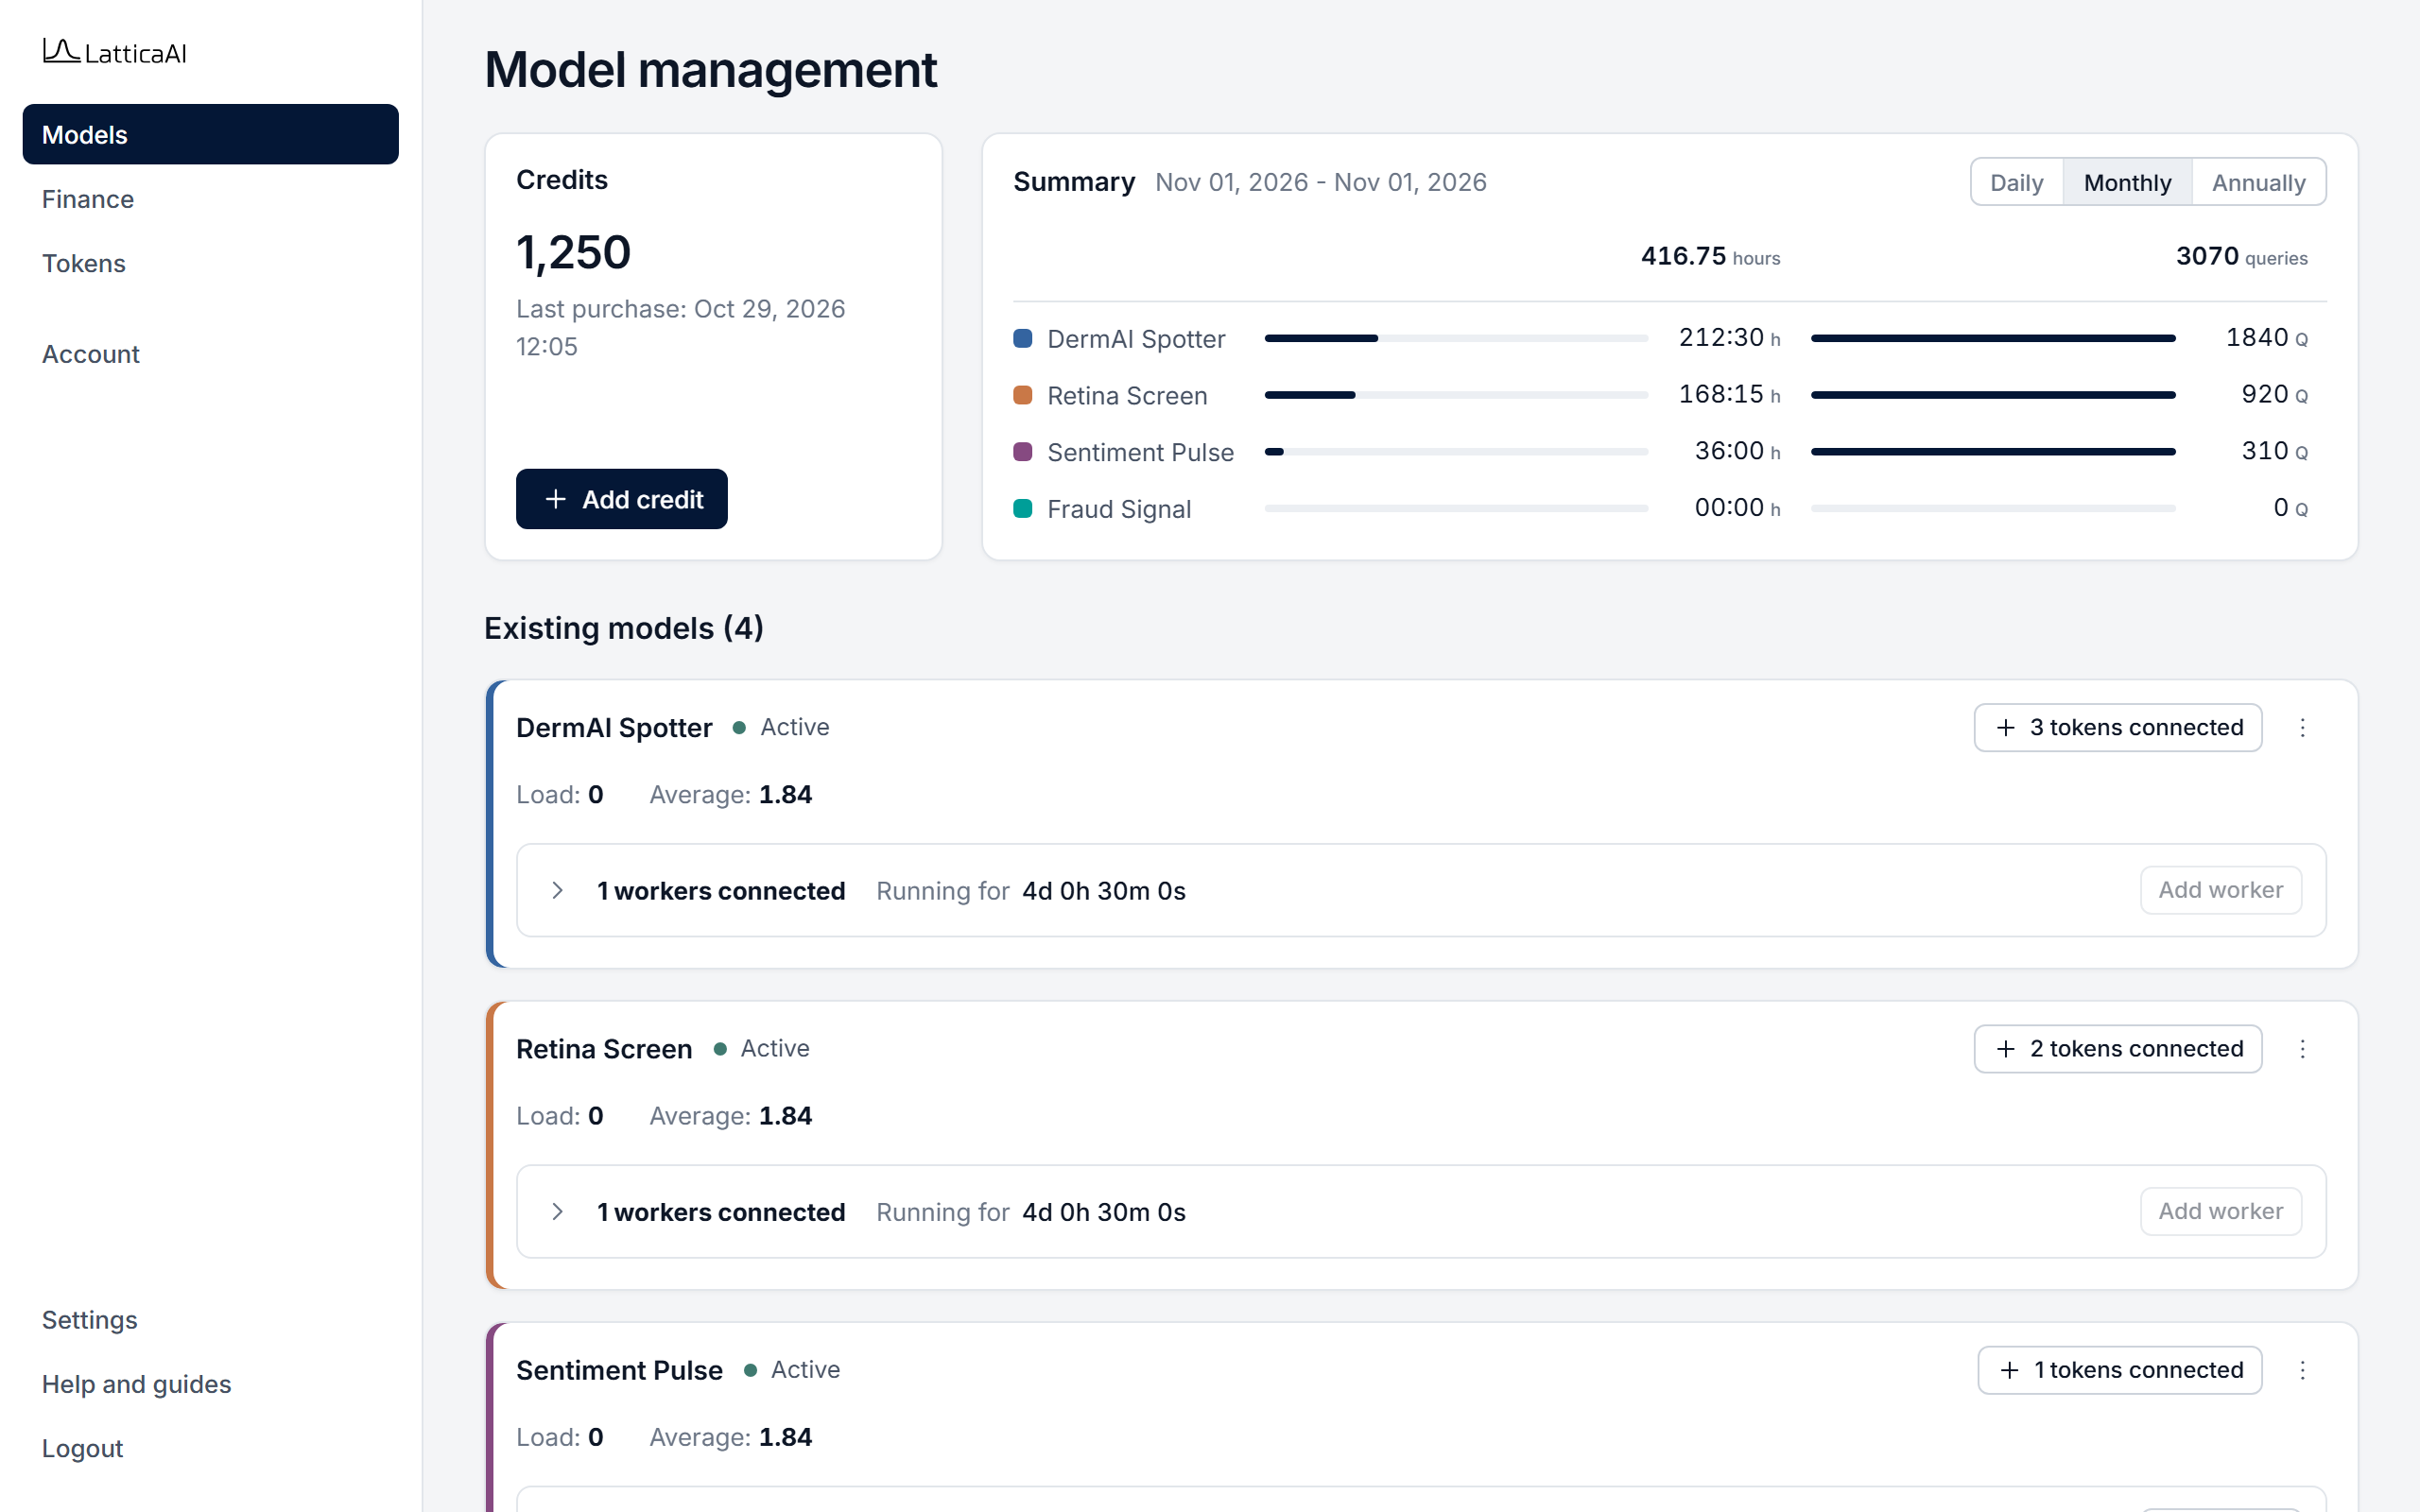
In the Console, open Models. In the Summary card, choose Daily, Monthly or Annually.
To run a model only when it is needed, start a worker for those hours and stop it when queries are not expected. Credit balance is covered in View Credit Balance and Add Credit.
List worker sessions in a date range with studio.workers.list_sessions. Each session is time a model's worker was running. Query counts for the same period are on the Summary card in the Console.
import os

from lattica_studio import LatticaStudio

studio = LatticaStudio(os.environ["LATTICA_LICENSE_KEY"])

# Every worker session of the account in October 2026 (ISO 8601 dates).
sessions = studio.workers.list_sessions(
    from_date="2026-10-01T00:00:00Z",
    to_date="2026-10-31T23:59:59Z",
)
studio.workers.display(sessions)
Query counts for the period are on the Console's Summary card. The SDK lists worker sessions, which is the runtime side of the same picture.