How-To: Monitor Worker Performance
This guide shows how to read a model's query times, its running worker and its usage in the Lattica Console, and how to check workers with the Python SDK.
Before you start
The average time, in seconds, the model took per query over the last 5 minutes. 0 means no queries in that time.
The average time, in seconds, per query over the last year. It's your baseline.
A Load well above Average means queries are running slower than usual right now, for example under a burst of requests.
Read the metrics
- Console
- Python SDK
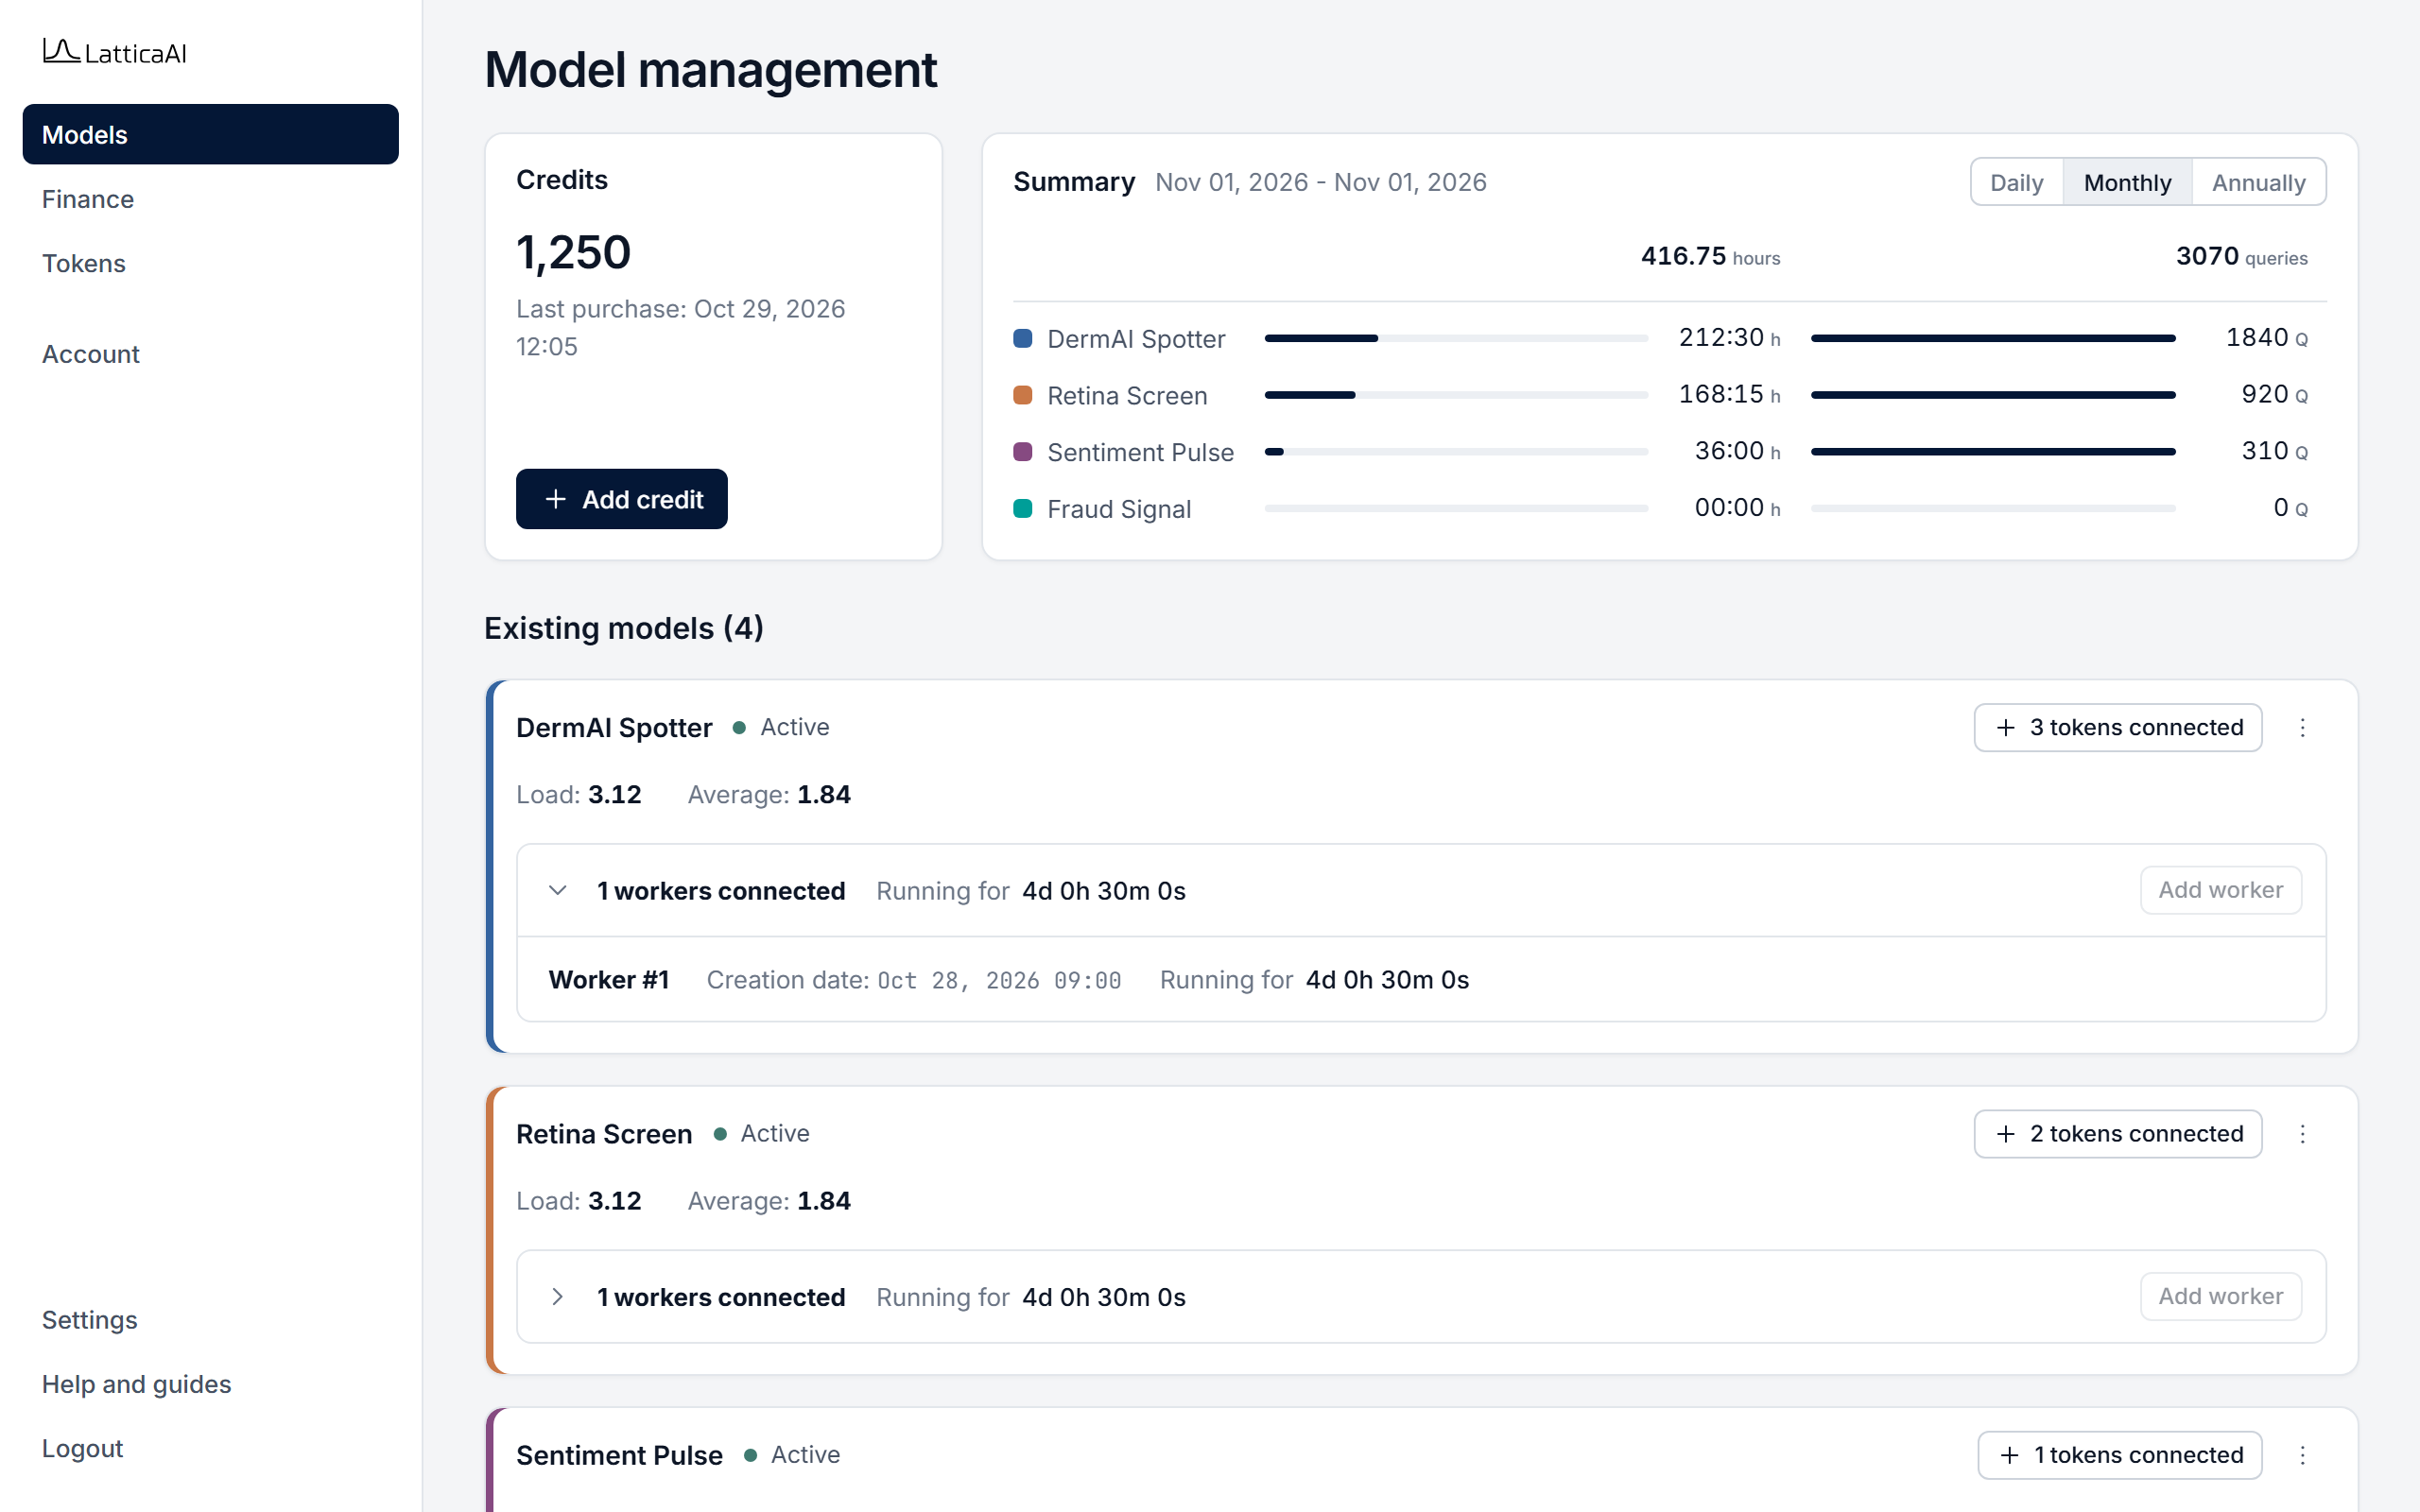
Load on the model's card is the average query time, in seconds, over the last 5 minutes. Here, 3.12 seconds.
Check a model's running worker with studio.workers.active, and list past worker sessions with studio.workers.list_sessions. studio.workers.display prints them as a table.
import os

from lattica_studio import LatticaStudio

studio = LatticaStudio(os.environ["LATTICA_LICENSE_KEY"])
model = studio.models.get_by_name("DermAI Spotter")

# The model's running worker, with its status and start time.
studio.workers.display(studio.workers.active(model.id))

# The model's worker sessions in October 2026 (ISO 8601 dates).
sessions = studio.workers.list_sessions(
    model_id=model.id,
    from_date="2026-10-01T00:00:00Z",
    to_date="2026-10-31T23:59:59Z",
)
studio.workers.display(sessions)
Load and Average are shown only in the Console. The SDK reports workers and their status, not query times.